Powder consumption
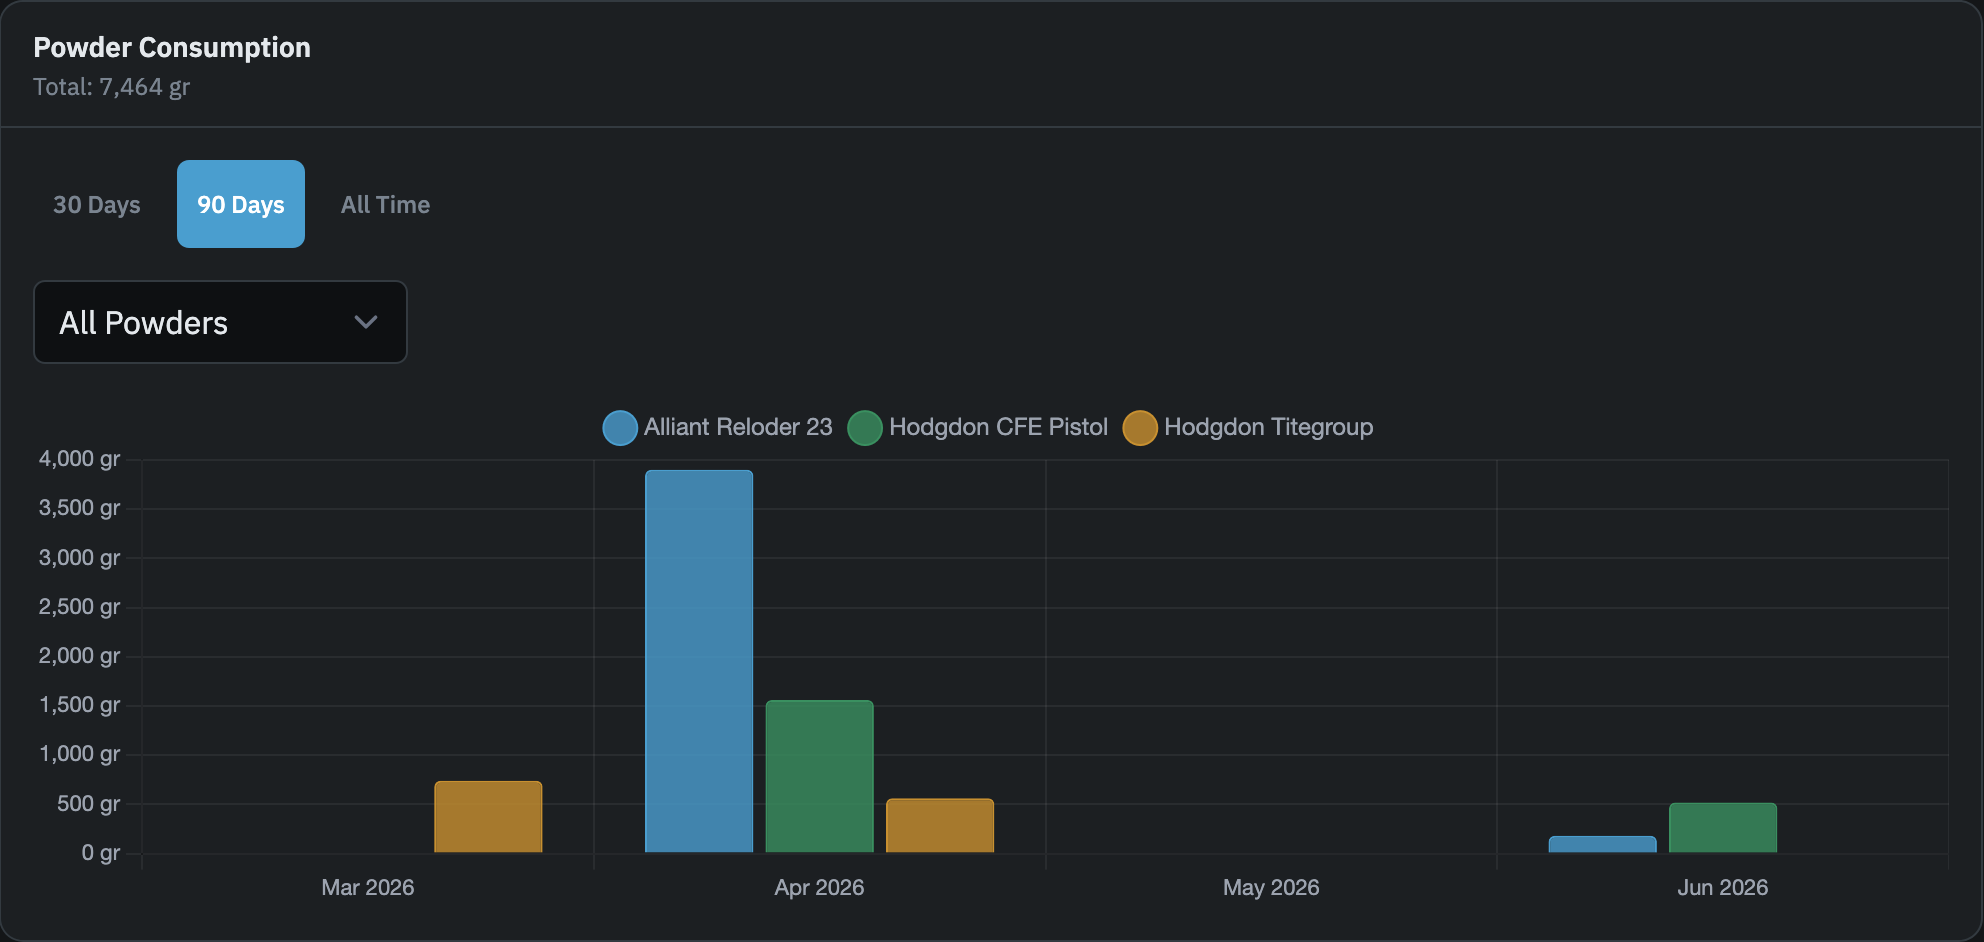
The Powder Consumption chart shows how many grains you burn through each month, broken down by powder. It lives on the Components tab of the Analytics page and is useful for understanding your burn rate and planning purchases before you run low.
What the chart shows
The chart is a bar chart with one month per x-axis bucket. Each powder you have used appears as a separate colored series. The y-axis is grains burned, calculated as charge weight multiplied by quantity loaded for every batch in the selected period. The card header shows the total grains burned across all powders and months currently visible.
Months with no batches for a given powder have no bar for that series. If you have only ever used one powder, only one series appears.
Period filter
Three buttons let you change the time window: 30 Days, 90 Days, and All Time. The default is 90 days. Switching periods updates the chart immediately. All Time shows every batch from your earliest record forward.
Powder filter
A dropdown above the chart lets you filter to a single powder. The list is grouped by brand and includes every powder you have ever used, regardless of the selected period. Selecting a specific powder hides all other series and rescales the chart to that powder alone. The "All Powders" option restores all series.
Free plan date limit
Free accounts see data limited to the last 30 days. This applies on top of the period filter, so selecting 90 Days or All Time on a free account will still only show the 30-day window. The banner at the top of the Analytics page notes this limit. Pro accounts see the full period as selected.