Ammo velocity comparison
This is a Pro feature. The Ammo velocity comparison section on the Analytics Ammo tab lets you plot velocity data across multiple firearms for a selected ammo source. It shows how a specific batch or factory load performs across different guns over time, using either date-averaged or individual group data.
Selecting an ammo source
The ammo selector appears in the Velocity by Firearm section at the bottom of the Ammo tab. Only ammo sources with at least one range group that has a velocity reading recorded appear in the list. Options are split into two groups:
- Handloads: batches identified by their batch identifier and caliber, for example "308W-A1B2C3 (308 Win)".
- Factory Ammo: catalog entries identified by brand, name, and caliber.
Selecting a different ammo source resets the firearm selection and returns the view to Averaged mode.
Selecting firearms
After choosing an ammo source, a firearm picker appears showing which of your firearms have velocity data for that selection. Firearms are grouped by platform type: Handguns, Rifles, Shotguns, Other, and Unspecified (firearms with no platform type set). If none of your firearms have velocity data for the selected ammo, the picker indicates that no data has been recorded.
Select one or more firearms to plot. The chart and view buttons appear once at least one firearm is selected.
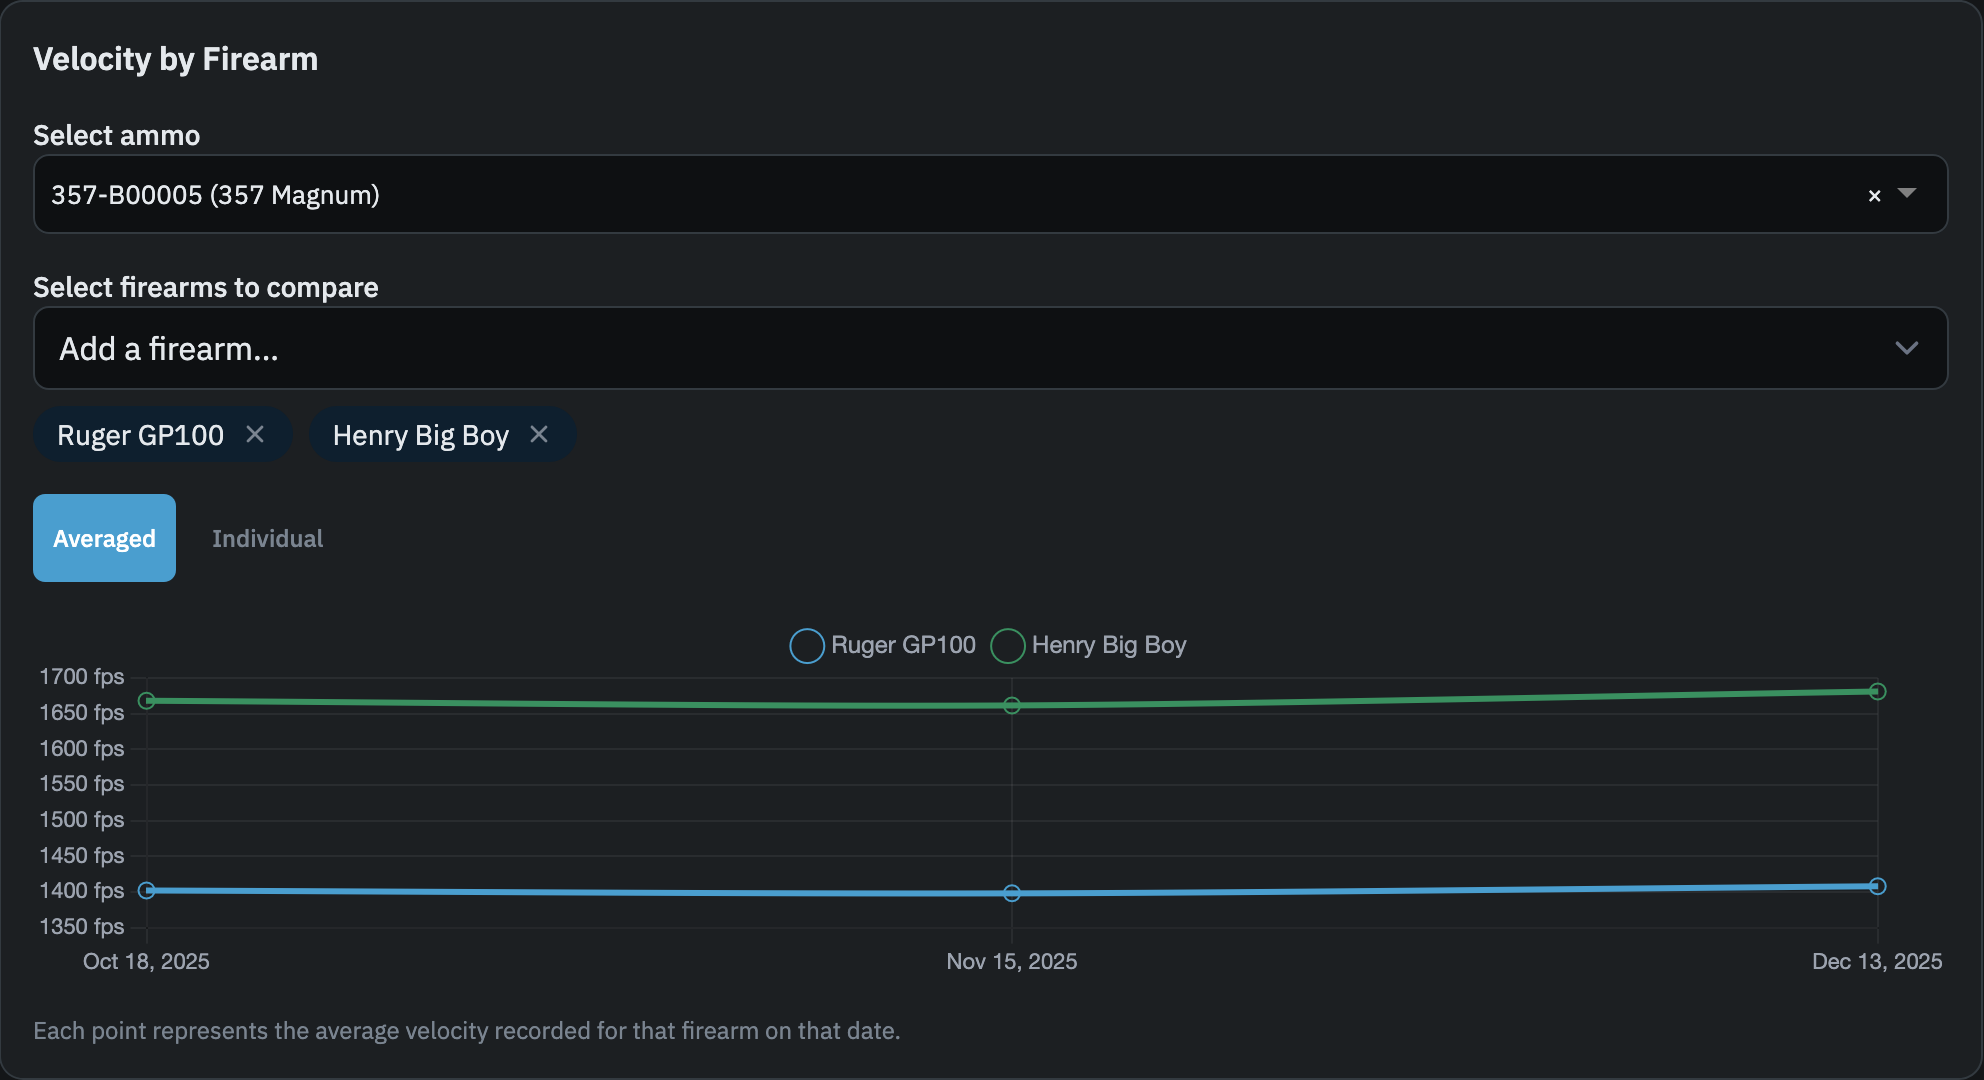
Averaged view
The default view. Each point on the line chart represents the average velocity recorded for that firearm on a given date, across all range groups logged that day. When multiple groups were fired on the same date, their velocities are averaged into a single point. One line is drawn per selected firearm, making it straightforward to compare how the same ammo performs across guns over time.
Individual view
Switch to Individual to see a scatter chart where each point is a single range group. Multiple points on the same date are separate groups from the same session or different sessions on that day. This view shows the spread of individual readings rather than a daily average, which is useful when you want to see session-to-session variation rather than a smoothed trend.