Analytics overview
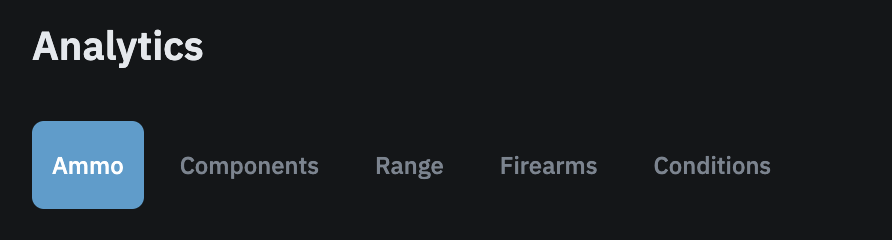
The Analytics page at /analytics pulls together your loading and shooting data in one place. It is organized into tabs: Ammo, Components, and Range are available to all accounts; Firearms and Conditions are available to Pro accounts only. Free accounts see data from the last 30 days; Pro accounts see full history with no date limit.
Free plan date limit
When you are on the free plan, a banner appears at the top of the Analytics page: "Free plan. Analytics data is limited to the last 30 days." with an Upgrade to Pro link. This limit applies to all data across every tab. Pro accounts see the full date range with no restriction.
Ammo tab
The Ammo tab is the default view when you open Analytics. It covers rounds on hand, loading activity, ammo costs, and (for Pro accounts) velocity comparison across firearms.
Several sections on this tab require inventory tracking to be enabled in Settings. If inventory tracking is off, the Ammo Cost Overview, Rounds on Hand Breakdown, Rounds on Hand, and Factory Ammo sections will not appear.
Ammo Cost Overview
A horizontal bar chart comparing your total factory ammo cost against total estimated handloaded ammo cost. For details on how cost data is captured and what drives the numbers, see the Cost breakdown article.
Rounds on Hand Breakdown
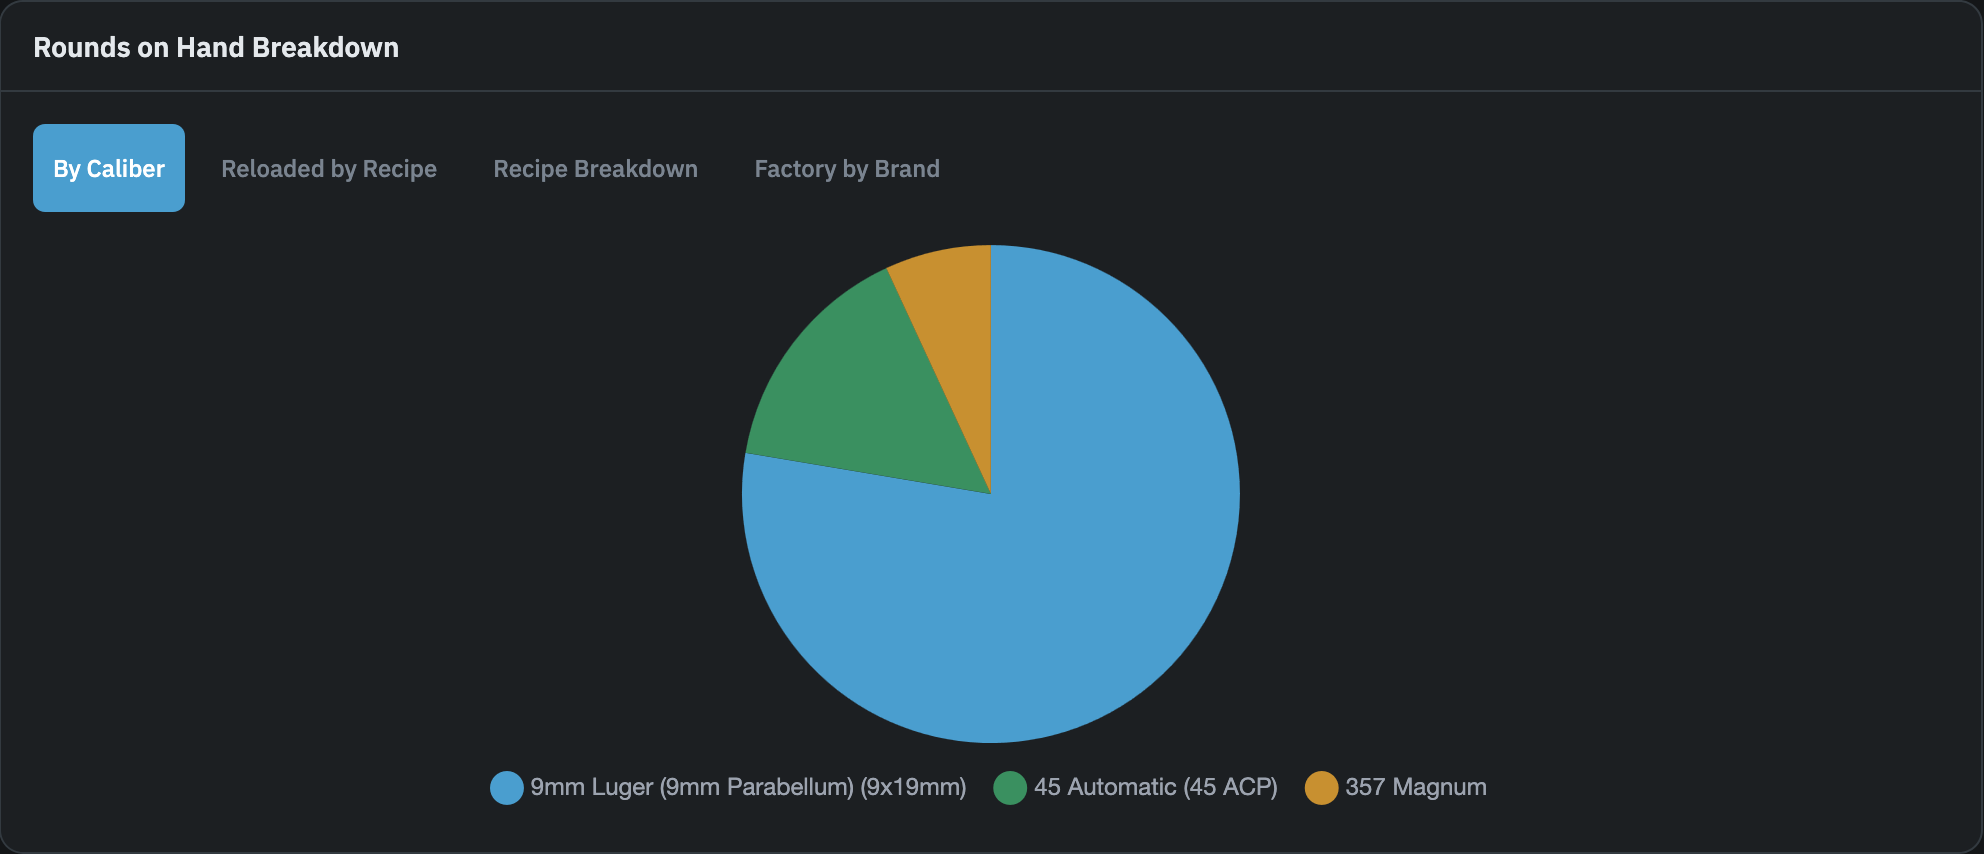
A pie chart with four sub-tabs showing your current rounds on hand from different angles:
- By Caliber: total rounds on hand across all your handloads, broken down by caliber.
- Reloaded by Recipe: handloaded rounds grouped by recipe.
- Recipe Breakdown: a per-recipe view by charge weight. A dropdown appears on this tab so you can select which recipe to view.
- Factory by Brand: factory ammo rounds on hand grouped by manufacturer.
Rounds on Hand
A list of your active handloads. Each row shows the recipe name linked to the recipe page, caliber badge, status badge, rounds currently on hand, and the last recorded group size in inches. If no group size has been recorded for a recipe, a dash appears in that position.
Rounds Loaded by Month
A bar chart showing how many rounds you loaded each month over the last six months. The card header shows the total rounds across all months in view. This card appears regardless of whether inventory tracking is enabled.
Factory Ammo
Lists your factory ammunition inventory. Each entry shows brand, name, caliber, quantity on hand, and cost per round if a price was entered. Clicking an entry opens the ammo inventory page. This card only appears when at least one factory ammo record exists in your inventory.
Cost per Round Over Time
Select a recipe from the dropdown to view a line chart of cost per round across your batches in chronological order, one point per batch. For details on how cost per round is calculated, see the Cost breakdown article.
Velocity by Firearm Pro
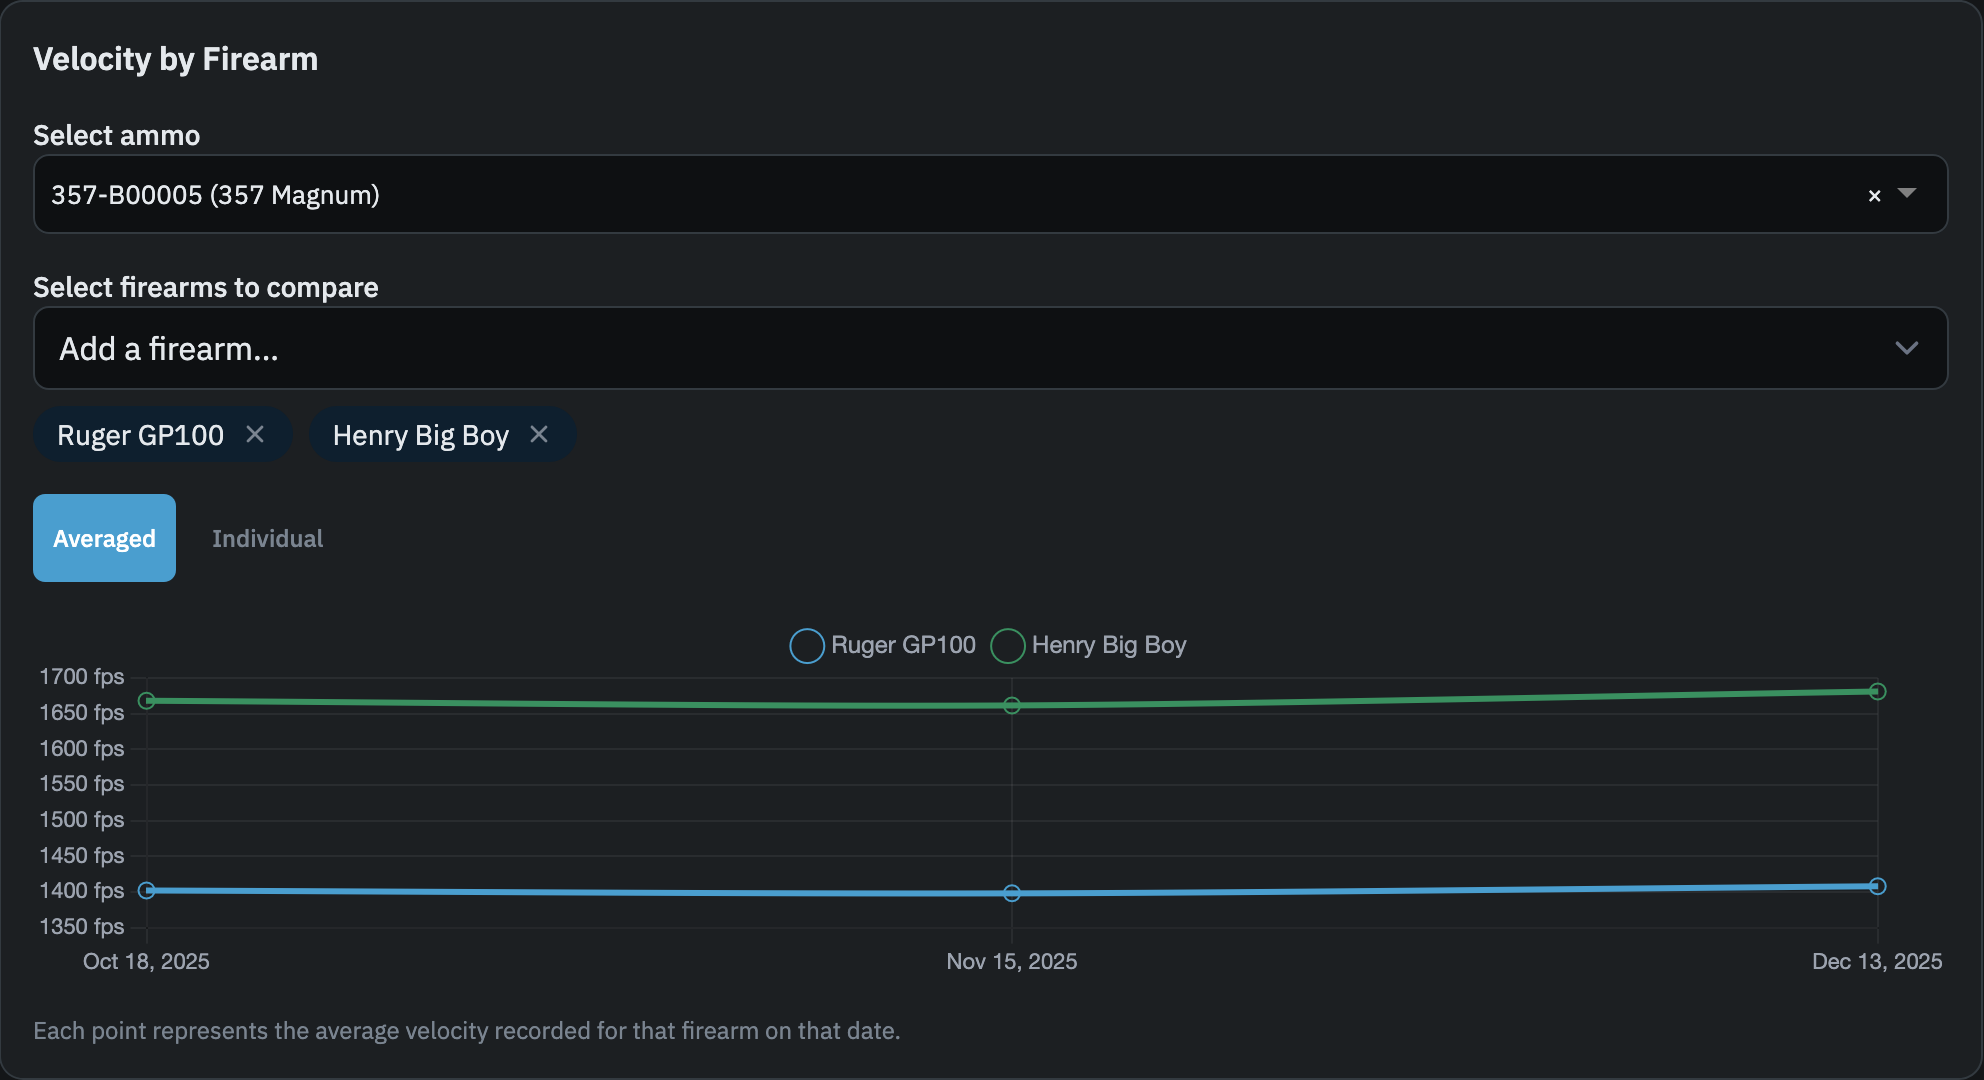
Compare velocity across firearms for a selected ammo source. Start by choosing an ammo source from the selector, which is split into two groups: Handloads and Factory Ammo. Only entries that have at least one range group with a velocity reading appear in the list.
After selecting ammo, a firearm picker appears showing which firearms have velocity data for that selection, grouped by Handguns, Rifles, Shotguns, and Other (firearms with no platform type set). Select one or more firearms to plot their velocity history. If the selected ammo has no velocity data recorded for any firearm, the picker shows "No velocity data has been recorded for this ammo."
Once at least one firearm is selected, two view buttons appear: Averaged and Individual.
- Averaged: a line chart where each point represents the average velocity recorded for that firearm on that date, across all groups logged that day.
- Individual: a scatter chart where each point is a single range group. Multiple points on the same date are separate groups or sessions.
Switching to a different ammo source always resets the view to Averaged.
Components tab
The Components tab covers powder usage and component inventory value. The Powder Consumption chart shows monthly grain burn-through broken down by powder, with period and powder filters. See the Powder consumption article for full details.
When inventory tracking is enabled, a second card shows the estimated current value of your component inventory broken down by brass, primers, powder, and bullets. See the Cost breakdown article for more on how inventory cost is calculated.
Range tab
The Range tab surfaces two cards from your range session data.
Best Performing Load
Shows the recipe with the best average group size across all measured range groups. The card displays the recipe name linked to the recipe page, caliber, average group size in inches, and the number of groups measured. This card only appears once at least one range group with a group size measurement has been recorded.
Recent Range Sessions
Lists your most recent range sessions. Each row shows the date, location (if recorded), total shots fired, and group count. Clicking a row opens the session detail page.
Firearms tab Pro
Lists all your firearms with total rounds fired. Each row shows the firearm name linked to its per-firearm analytics page, caliber badges, and a rounds fired count. If no firearms have been added yet, an empty state prompts you to add one.
For per-firearm analytics including best load, session history, and velocity charts, see the Firearm analytics article.
Conditions tab Pro
The Conditions tab shows how environmental factors correlate with your shooting results. Select a caliber from the dropdown at the top of the page first; no charts appear until a caliber is chosen.
Temperature Correlation
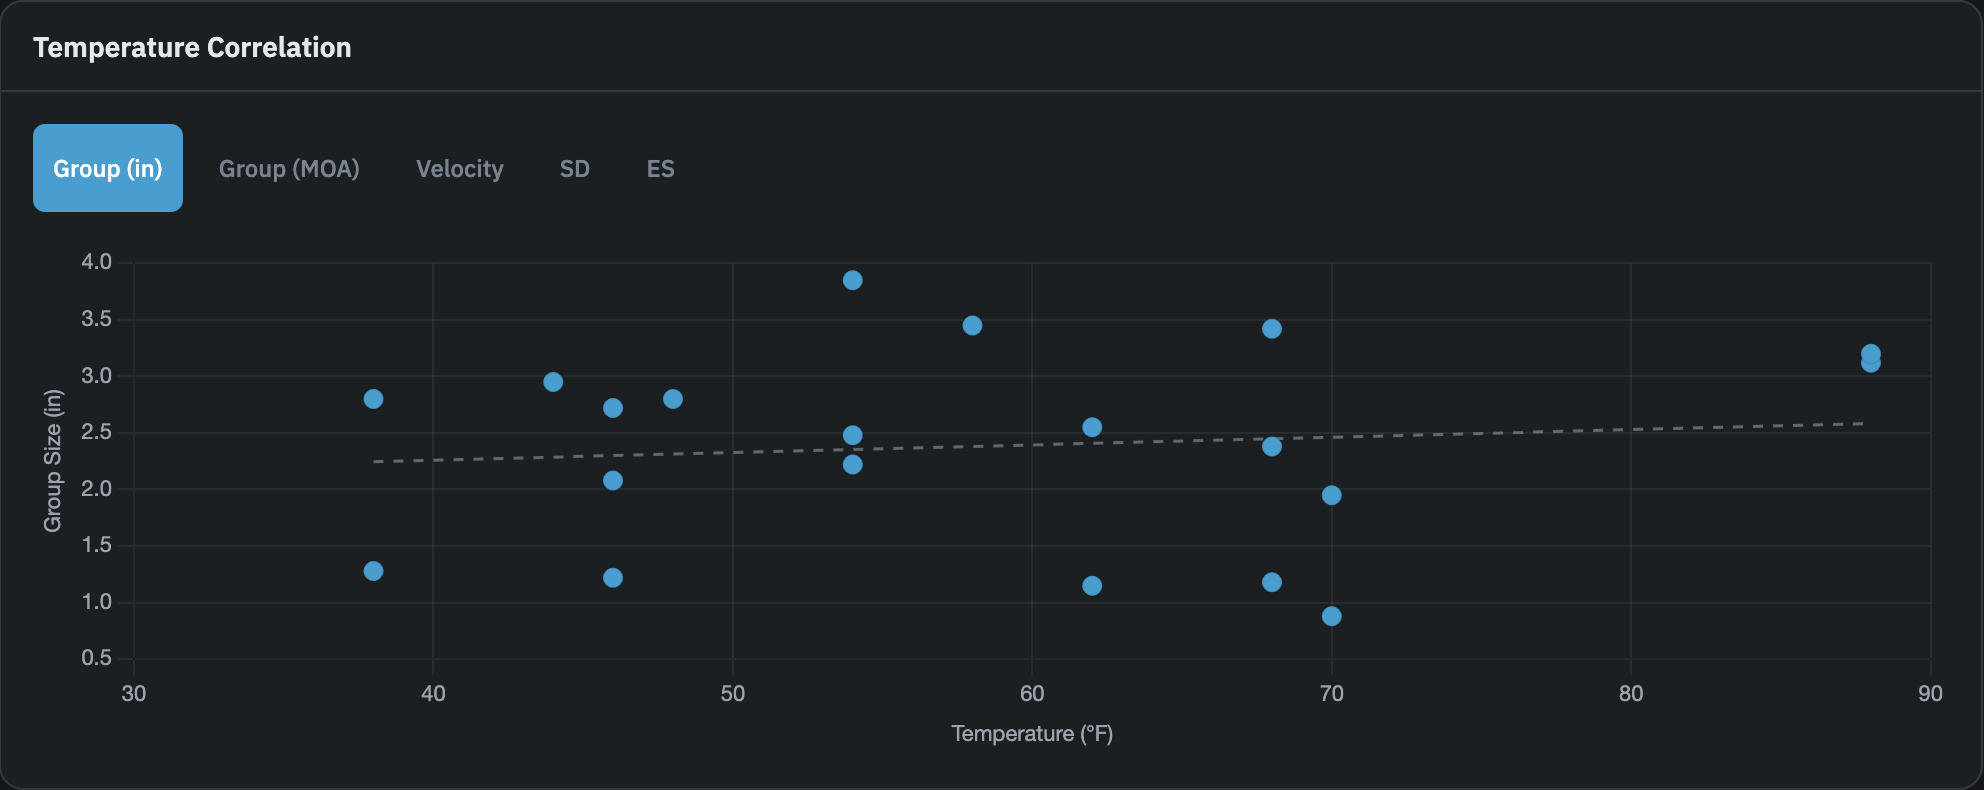
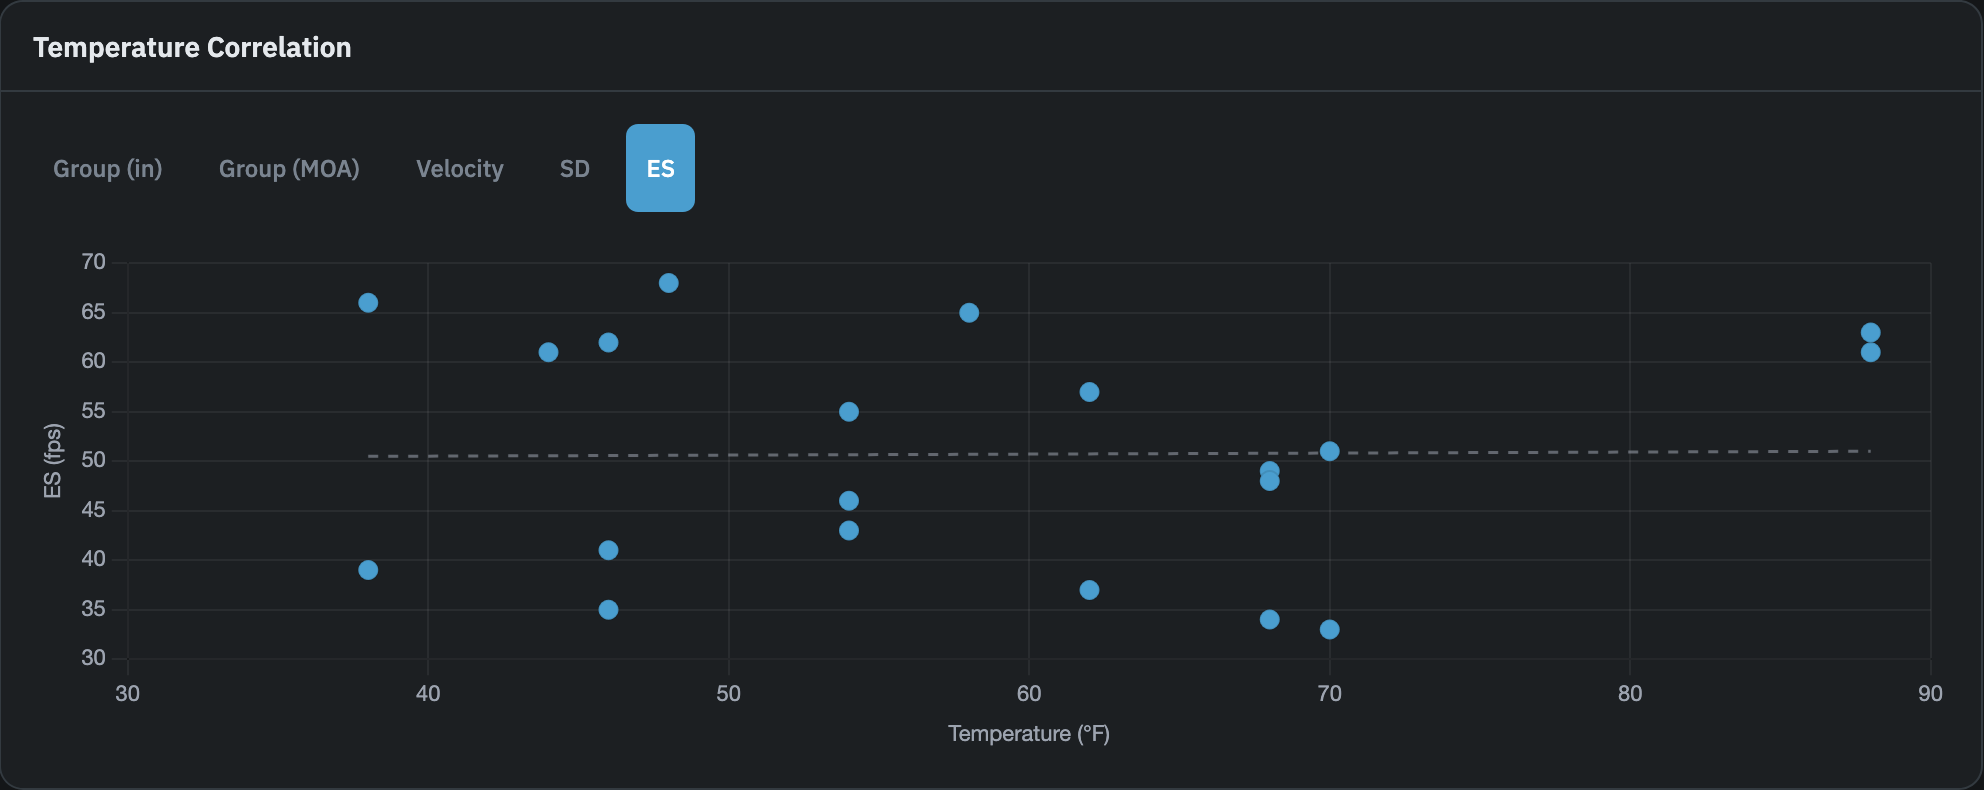
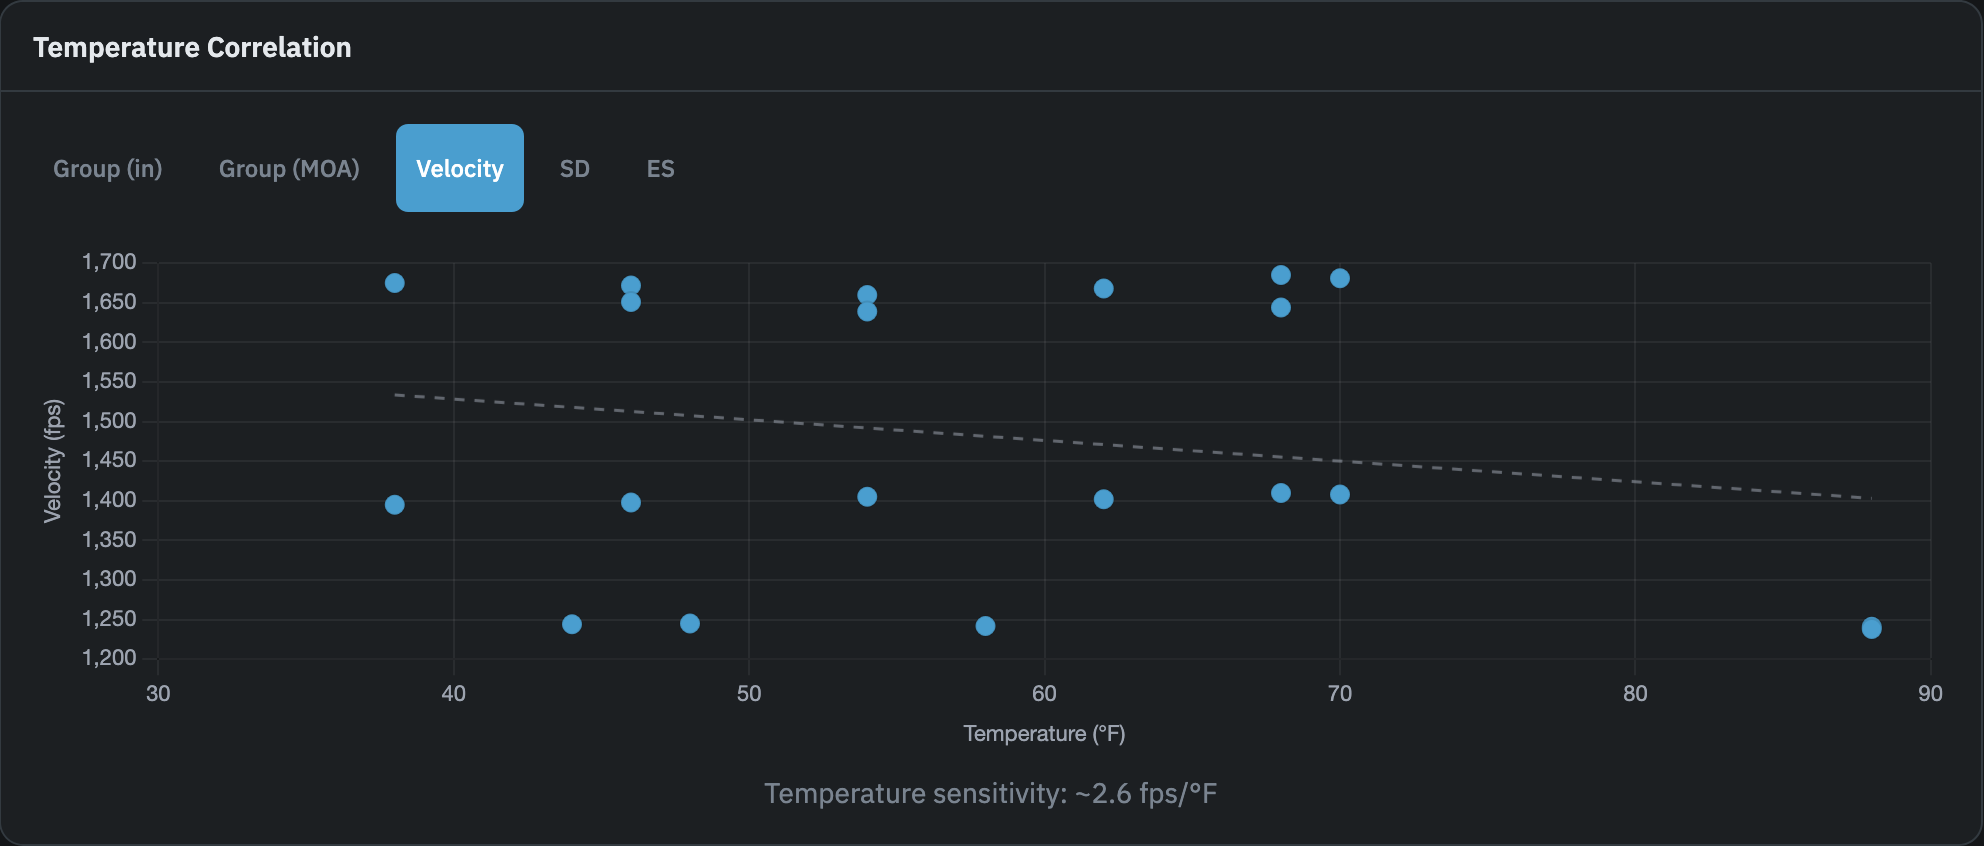
A scatter chart plotting shooting metrics against temperature in °F. Switch between five metrics using the sub-tabs: Group (in), Group (MOA), Velocity, SD, and ES. The chart requires at least 3 range sessions with temperature and group size recorded for the selected caliber before data appears. If that threshold has not been reached, a message says so. When fewer than 3 data points exist for the active metric, a note beneath the chart indicates not enough data is available for that metric yet. When 3 or more data points exist for the active metric, a dashed trend line is overlaid on the scatter showing the direction of the correlation. On the Velocity tab, a temperature sensitivity label appears beneath the chart when trend data is available, showing approximately how many fps velocity changes per degree Fahrenheit.
Wind Correlation
Two views of how wind conditions relate to group sizes. Use the buttons above the card to switch between them:
- vs Wind Speed: a scatter chart of group size in inches against wind speed in mph. A dashed trend line is overlaid when 3 or more data points are available.
- by Direction: a bar chart of average group size grouped by wind direction.
Both views require at least 3 range sessions with wind speed and group size recorded for the selected caliber before data appears.